fractals-the poetry of complex numbers
A peek in the multi-dimensional magic
Nature sure is an artist ! in every flower pattern , every tree shape, in the flow of rivulets you see art and you hear music. Though most of it may seem beautiful to us due to its abstract nature, it is in fact as precise in form as it can get … it is in fact based on the language of mathematical poetry called probability. Probability is what brings about the patterns that we see in the flowers or the movement of birds ( though physics underlies the principles the patterns are still probabilistic not deterministic) or even the design of the cosmos. The rhythm of the cosmos i.e the frequencies at which matters vibrate due to a confluence of forces like gravity or the weak and the strong forces are all probabilistic.
our very own light also is a probability wave. Information itself that is a manifestation of randomness ( the less likely is the occurrence of an event the greater is the information contained in it ) is is a function of probability.
Why does a rose stem have 1….2…3...5...8…13 shoots ? ( Fibonacci sequence for you ). This is because the leaves in the new shoots need to soak in the sunlight and any other number of shoots would be arranged such that they would block the sunlight of the other shoots. So the shoots are in the fibonnaci sequence. That is the power of probability for you.
Let us look at a yet amazing facet of patterns that are generated not by nature or neither by probabilistic processes but by mathematics more precisely polynomials. These patterns are called fractals. And analysis of fractals is a big business in the analysis of businesses ( stock prices, game theory , behavorial analysis , business simulation) . this is because fractals add to the dimensions of your thinking .. and they do it quite literally.
Benoit Mandelbrot is generally considered to be the father of fractals. He coined the term fractal to describe curves, surfaces and objects that have some very peculiar properties. We learnt in school that simple curves, such as a line, have one dimension. Squares, rectangles, circles, polygons, etc. have two dimensions, while solid objects such as a cube, have three dimensions. The three dimensions define space. Time can be considered a fourth dimension. We normally think of dimensions as integers: 1, 2, 3, . . .
What is so peculiar about about fractals is that they have fractional dimensions! A fractal curve could have a dimensionality of 1.4332, for example, rather than 1. Fractals are not just a mathematical curiosity. Most natural objects are fractal by nature, and can be best described using fractal mathematics. Clouds, leaves, the blood vessel system, coastlines, particles of lint, etc. have fractal shapes.
Fractals are generated by an iterative process - doing the same thing again and again. Fractals also have the property that when you magnify them they still look much the same. This is called self-similarity.
The mathematics behind it deals with the amazing properties of complex numbers to add dimensions to a data ( a number X is one dimensional ,but in complex domain it is x+iy i.e it has miraculously become 2 dimensional )
The most popular of the fractals are the divergent set represented by a innocuous looking function ( polynomial in complex domain )
zn+1 = z2n + c
This equation uses complex numbers for z and c where c is a constant.
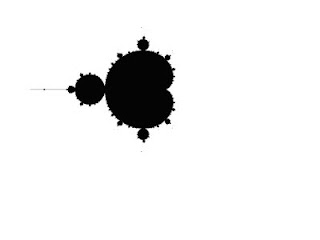
The Mandelbrot equation is an iterative equation, that is, each value of z generated on the left side is fed back in on the right side to generate a new value of z. This produces a sequence of z values: z0, z1, z2, z3... Typically, the starting point is z0 = (0, 0). Each value of the complex constant c will generate a different sequence. Let's consider a graph with the X axis (real axis) covering the range -2.5 to 1.5 and the Y axis (imaginary axis) covering the range -1.5 to 1.5. Consider that each point on this graph represents a possible value for c, and that iterations start with z0 = (0, 0). Let's determine whether to make a dot on the graph at a given c value based upon the results of iterating the Mandelbrot equation. If we iterate the Mandelbrot equation long enough, the absolute values of some of the sequences will "blow up" to infinity, and some will cycle around with values less than 2. That is, the sequence stays bounded. It can be proven that if the absolute value ever exceeds 2 in the sequence it will always "blow up". The Mandelbrot set is all the values of c which give sequences that are bounded. The image below is a representation of the Mandebrot set:
The border of the Mandelbrot set is infinite in length, and is "self-similar". That is, any magnification of the border will look similar at any level of magnification.
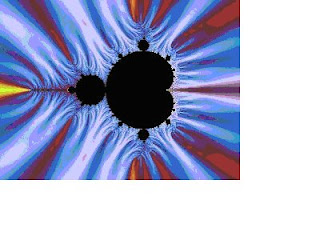
The divergent set can create wonderful colour play
From a fractal art perspective, it is the region where the Mandebrot sequences DIVERGE that is most interesting. Coloring the region outside the set can produce spectacular images, and so fractal images generated from functions like the Mandelbrot function are generally created from the divergent region of the functions. The areas of greatest interest, which produce images with the highest level of detail, are near the borders of the Mandelbrot set. This is illustrated in the next image, which uses a coloring method called "triangle inequality":

In the regions near the Mandelbrot set, the sequences, which are sometimes called "orbits" because if they are plotted they tend to follow ellipsoid or spiral paths, will eventually "blow up" to infinity. One method for coloring the divergent region is to set a threshold value, called a "bailout", If the absolute value of a member of the sequence exceeds the bailout value, then the point on the complex plane represented by c is colored according to the number of iterations needed to exceed the bailout. This was the first and most common way to color fractals.
Now the fractals are also used to extrapolate the bond curve yields given a starting value of constant C. the self-similarity allows the iterative function to be independent of time and magnitude of the calculations

Comments